Rework
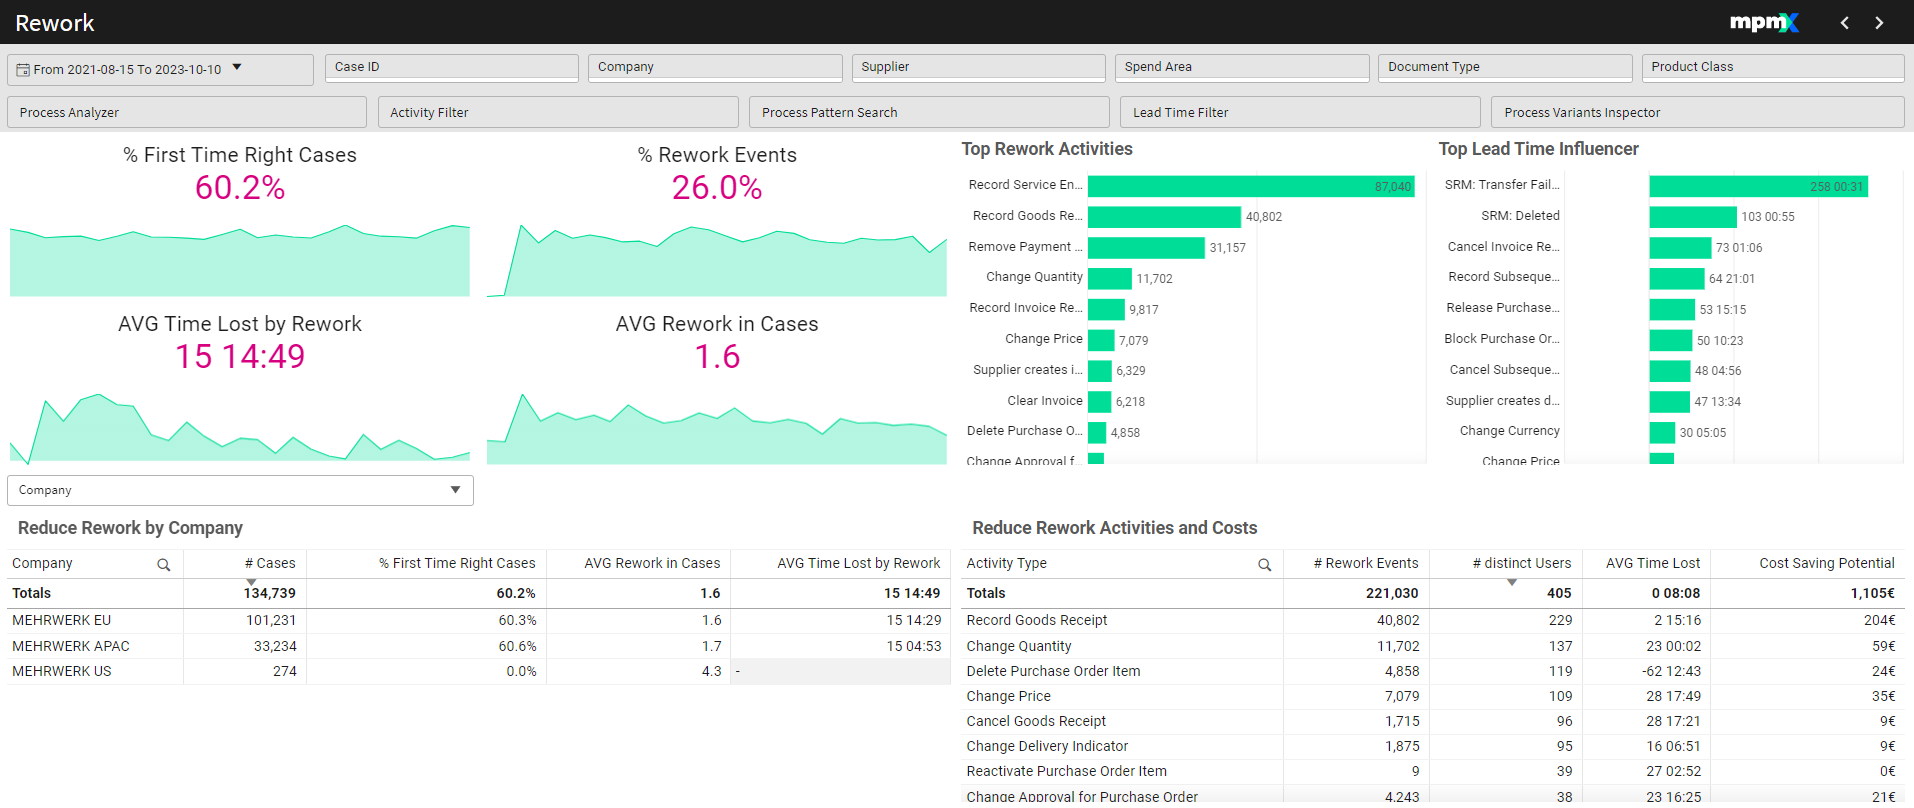
The Rework Worksheet helps identify inefficiencies caused by rework, which increases costs and extends lead times. Rework can occur in production or operational processes, affecting downstream activities, including colleagues, suppliers, and customers.
Key metrics such as First Time Right Cases, Rework Rate, and Time Lost by Rework provide insights into process inefficiencies. Interactive visualizations highlight frequent rework activities and their impact on lead times, while detailed tables enable further analysis by dimensions or specific activities.
By analyzing rework trends, users can develop targeted strategies to reduce rework, improve efficiency, and lower costs.
Why Rework Matters
Rework is a major driver of process costs and lead time increases. Reducing rework improves efficiency, speeds up processes, and enhances overall performance.
Key Figures
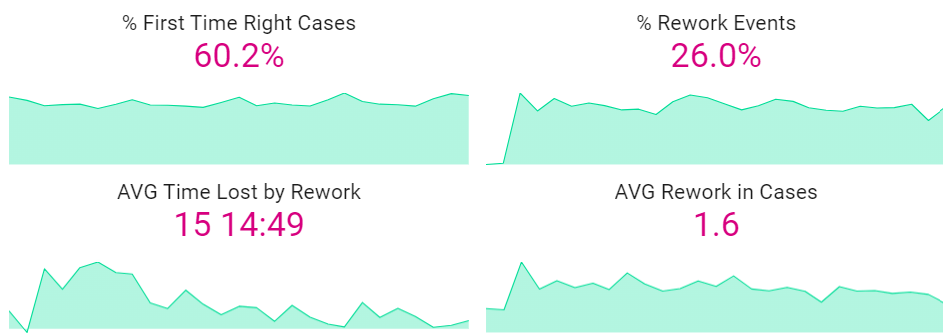
% First Time Right Cases
- The percentage of cases without rework in any activity.
- Higher is better - this indicates a more efficient process.
- A timeline below shows trends over time.
% Rework Events
- The percentage of process events classified as rework, such as changes, adjustments, deletions, or cancellations.
- Lower is better - a high value suggests inefficiencies.
AVG Time Lost by Rework
- Measures the negative impact of rework activities on overall process time.
- Lower is better - reducing time lost to rework speeds up processes.
AVG Rework in Cases
- Shows the average number of rework events per case.
- Lower is better - fewer rework steps mean a smoother workflow.
Top Rework Activities | Bar Chart
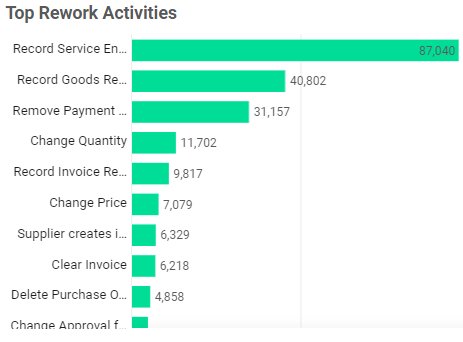
- Displays the most frequent rework activities in the process.
- Selecting bars filters the worksheet to focus on specific rework events.
Top Lead Time Influencer | Bar Chart
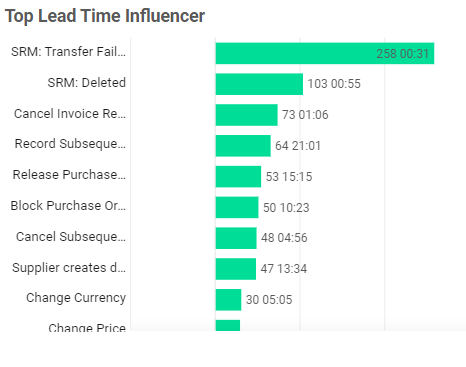
- Highlights rework activities that have the biggest impact on lead time.
- Helps prioritize high-impact rework reductions for process improvement.
A high-impact activity affecting only a few cases may not be as important as a smaller-impact activity affecting many cases. Prioritize optimizations that bring the biggest overall improvement.
Reduce Rework By [Dimension] Table
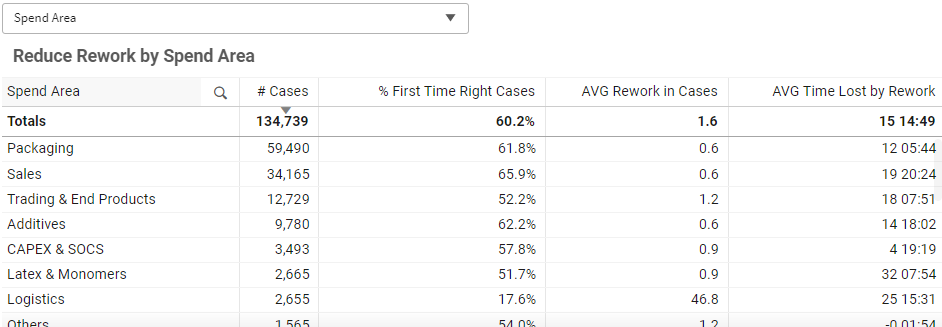
- Dropdown Selection – Analyze rework by dimension (e.g. Supplier, Product Class).
- Metrics include:
- Number of cases
- % First Time Right Cases
- AVG Rework in Cases
- AVG Time Lost by Rework
Reduce Rework Activities and Costs Table
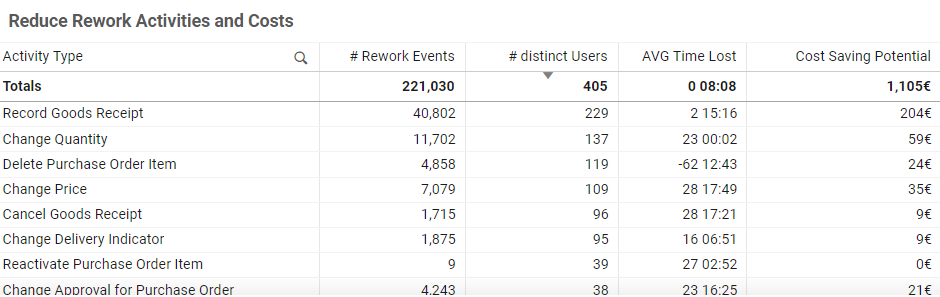
- Lists each rework activity alongside key metrics:
- Number of events
- Number of users performing the activity
- Time lost due to rework
- Potential cost savings if the activity is eliminated